
Bank of Montreal
BMO · TSX · CAD
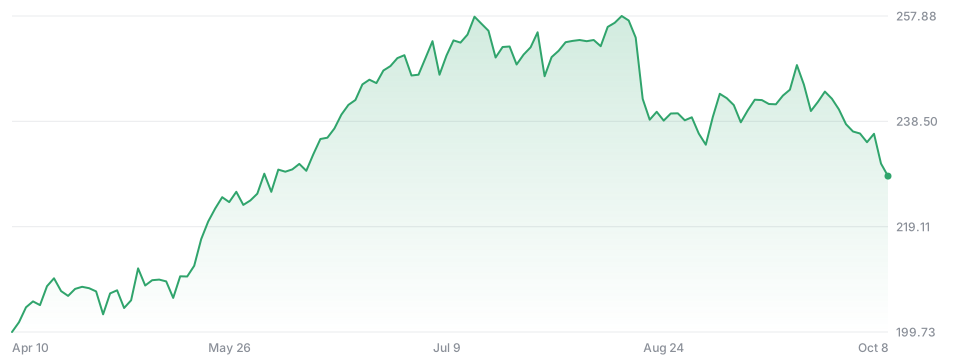
CA$228.42
−2.30 −1.00%todayNot financial advice.
- Open
- 228.27
- Day range
- 227.10 - 230.66
- 52-week range
- 168.92 - 259.20
- Volume
- 3.82M
- Market cap
- 111.49B
- P/E ratio
- 18.62
- EPS
- 8.77
- Dividend yield
- 2.92%
- Beta
- 0.77
Performance
W
−3.62%
1M
−5.33%
3M
−9.06%
6M
+15.83%
YTD
+27.68%
Y
+26.90%
5Y
+76.21%
All
+1,305.66%
In the news
Oct 8
MicroSectors FANG+ ETN FNGS Hits New 52-Week High on Tech Momentum
The MicroSectors FANG+ ETN (FNGS) touched a new 52-week high, gaining 49.5% from its low as tech momentum and interest rate optimism drive buying pressure.
Markets
Oct 8
Bank of Montreal Launches Latin America ETF and Two Bond Series on Toronto Stock Exchange
Bank of Montreal has introduced a Latin America GDP-weighted index ETF alongside two new bond fund series on the Toronto Stock Exchange.
Company news
Embed on your site
Embed docsAdd a live price card or a chart to any page. Free, no sign-up; cards refresh every minute and link back here.
<iframe src="https://stocks.freetheai.org/embed/TSX-BMO" width="340" height="170" style="border:0;max-width:100%" loading="lazy" title="Bank of Montreal (BMO) - FreeTheAI Stocks"></iframe>
<p style="font-size:12px"><a href="https://stocks.freetheai.org/symbols/TSX-BMO">BMO stock price</a> by FreeTheAI Stocks</p>