
Occidental Petroleum Corporation
OXY · NYSE · USD
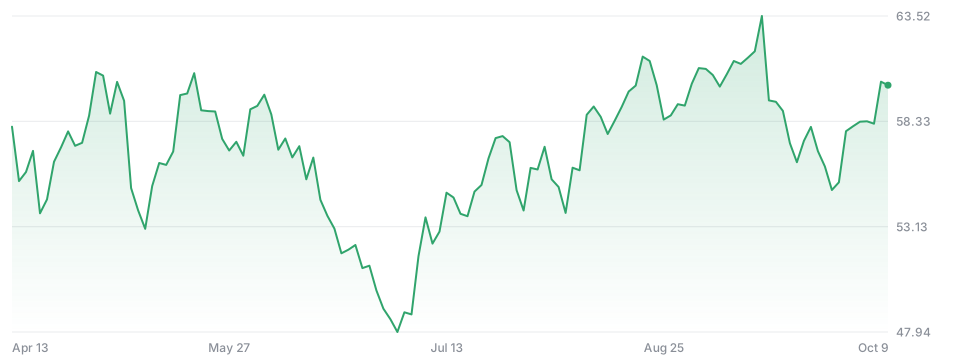
$60.11
−0.17 −0.28%todayNot financial advice.
- Open
- 59.91
- Day range
- 59.79 - 60.93
- 52-week range
- 38.80 - 67.45
- Volume
- 6.7M
- Market cap
- 60.09B
- P/E ratio
- 17.81
- EPS
- 3.43
- Dividend yield
- 1.73%
- Beta
- -0.92
Performance
W
+5.63%
1M
−2.52%
3M
+14.43%
6M
+3.57%
YTD
+45.76%
Y
+32.52%
5Y
+81.11%
All
+231.26%
In the news
Oct 8
Oil Stocks Rise as Gulf Tanker Attack and Hurricanes Disrupt Crude Supplies
Shares of major oil companies rose after a Gulf tanker attack and hurricane shutdowns squeezed supplies, pushing Brent crude prices above $104.
Energy
Oct 8
Trump Rules Out Iran Military Action Before Midterm Elections as EPA Proposes Methane Deregulation
President Trump ruled out military action against Iran before the midterms, while the EPA proposed methane rule rollbacks to aid oil producers.
Energy
Oct 8
EPA Moves to Roll Back Biden-Era Methane Rules in $45 Billion Regulatory Relief for Oil and Gas Producers
The EPA is proposing to weaken Biden-era methane controls, a move that could save oil and gas producers an estimated $45 billion annually.
Regulation
Embed on your site
Embed docsAdd a live price card or a chart to any page. Free, no sign-up; cards refresh every minute and link back here.
<iframe src="https://stocks.freetheai.org/embed/NYSE-OXY" width="340" height="170" style="border:0;max-width:100%" loading="lazy" title="Occidental Petroleum Corporation (OXY) - FreeTheAI Stocks"></iframe>
<p style="font-size:12px"><a href="https://stocks.freetheai.org/symbols/NYSE-OXY">OXY stock price</a> by FreeTheAI Stocks</p>