
EMCOR Group, Inc.
EME · NYSE · USD
$789.45
+11.21 1.44%todayNot financial advice.
- Open
- 788.15
- Day range
- 774.74 - 793.95
- 52-week range
- 564.92 - 951.96
- Volume
- 180.58K
- Market cap
- 34.82B
- P/E ratio
- 24.5
- EPS
- 32.3
- Dividend yield
- 0.18%
- Beta
- 0.85
Performance
W
+1.21%
1M
+3.65%
3M
+1.52%
6M
−1.20%
YTD
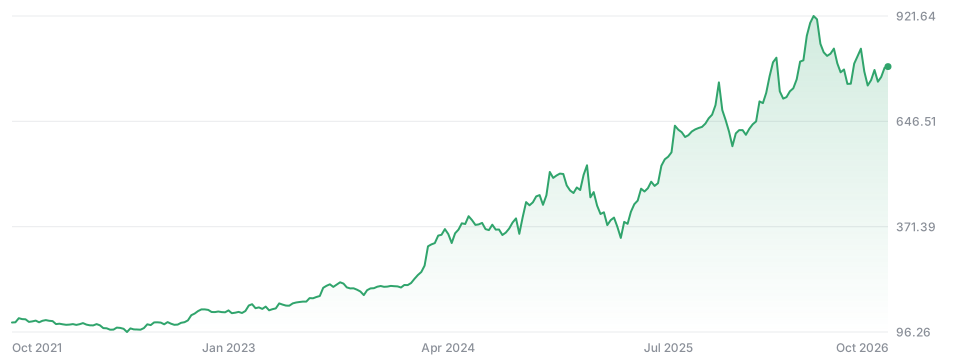
+28.06%
Y
+13.59%
5Y
+565.02%
All
+59K%
In the news
Oct 9
Dycom Posts Strong Q2 Revenue But Weak Guidance As Engineering Stocks Slump
Dycom Industries reported a 45.6% revenue jump in Q2, but weak guidance dragged down its stock alongside other engineering and design services peers.
Earnings
Oct 8
EMCOR Group Acquires Five Electrical Firms for $750 Million to Expand AI and Data Center Reach
EMCOR Group (EME) is buying five electrical firms for $750 million to expand its presence in the growing AI and data center infrastructure markets.
Mergers
Oct 7
SiteOne and Industrial Stocks Fall as Treasury Yields Rise
SiteOne and other industrial shares fell as rising Treasury yields and climbing oil prices dampened investor sentiment ahead of Fed minutes.
Economy
Embed on your site
Embed docsAdd a live price card or a chart to any page. Free, no sign-up; cards refresh every minute and link back here.
<iframe src="https://stocks.freetheai.org/embed/NYSE-EME" width="340" height="170" style="border:0;max-width:100%" loading="lazy" title="EMCOR Group, Inc. (EME) - FreeTheAI Stocks"></iframe>
<p style="font-size:12px"><a href="https://stocks.freetheai.org/symbols/NYSE-EME">EME stock price</a> by FreeTheAI Stocks</p>