
Sobha Limited
SOBHA · NSE · INR
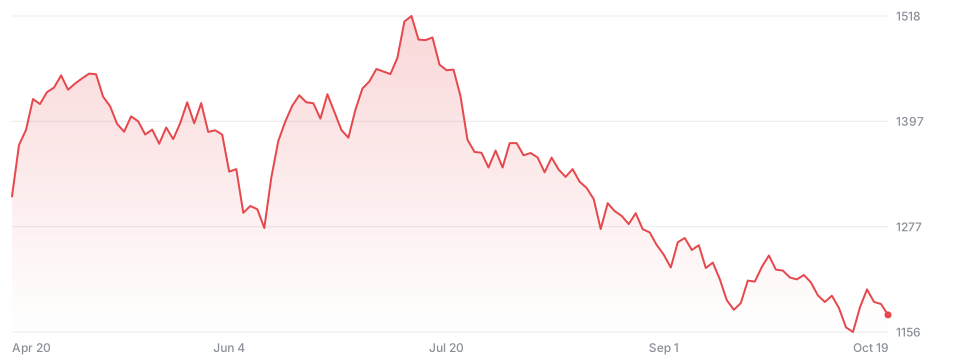
₹1,176.00
−12.40 −1.04%todayNot financial advice.
- Open
- 1,192.70
- Day range
- 1,172.00 - 1,205.60
- 52-week range
- 1,130.00 - 1,732.00
- Volume
- 164.72K
- Market cap
- 1.34B
- P/E ratio
- 54.53
- EPS
- 0.23
- Dividend yield
- 0.51%
- Beta
- 1.09
Performance
W
+1.29%
1M
−1.40%
3M
−23.65%
6M
−14.60%
YTD
−19.84%
Y
−23.59%
5Y
+45.52%
All
+7.86%
In the news
Oct 19
Sobha Ltd Q2 Net Profit Falls 55% to ₹33 Crore on Lower Income
Sobha Ltd reported a 55% decline in second-quarter net profit to ₹32.95 crore due to lower revenue, though six-month income saw only a minor drop.
Earnings
Embed on your site
Embed docsAdd a live price card or a chart to any page. Free, no sign-up; cards refresh every minute and link back here.
<iframe src="https://stocks.freetheai.org/embed/NSE-SOBHA" width="340" height="170" style="border:0;max-width:100%" loading="lazy" title="Sobha Limited (SOBHA) - FreeTheAI Stocks"></iframe>
<p style="font-size:12px"><a href="https://stocks.freetheai.org/symbols/NSE-SOBHA">SOBHA stock price</a> by FreeTheAI Stocks</p>