
Hindalco Industries Limited
HINDALCO · NSE · INR
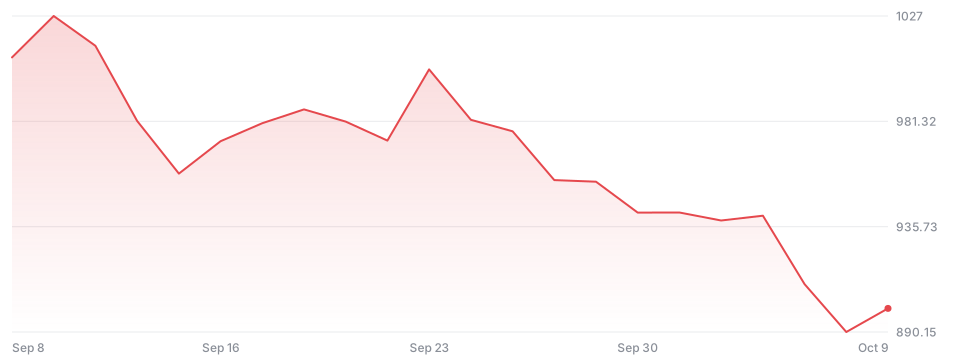
₹900.35
+10.20 1.15%todayNot financial advice.
- Open
- 893.85
- Day range
- 886.80 - 900.60
- 52-week range
- 754.45 - 1,176.00
- Volume
- 3.5M
- Market cap
- 20.86B
- P/E ratio
- 12.21
- EPS
- 0.78
- Dividend yield
- 0.56%
- Beta
- 0.61
Performance
W
−3.71%
1M
−11.20%
3M
−7.75%
6M
−9.54%
YTD
+1.38%
Y
+16.89%
5Y
+87.20%
All
+1,275.04%
In the news
Oct 10
Indian Markets End 8-Week Losing Streak as Domestic Buying Offsets Rs 30,294 Crore Foreign Outflow
Domestic institutional buying of Rs 30,313 crore helped Indian benchmark indices end an eight-week losing streak, offsetting heavy foreign equity sales.
Markets
Oct 9
Gender Gap Persists in India's Energy Sector as Women Hold Only 1% of Technical Roles
Women represent 32% of India's energy workforce but only 1% of technical roles, highlighting critical retention challenges for heavy industries.
Energy
Embed on your site
Embed docsAdd a live price card or a chart to any page. Free, no sign-up; cards refresh every minute and link back here.
<iframe src="https://stocks.freetheai.org/embed/NSE-HINDALCO" width="340" height="170" style="border:0;max-width:100%" loading="lazy" title="Hindalco Industries Limited (HINDALCO) - FreeTheAI Stocks"></iframe>
<p style="font-size:12px"><a href="https://stocks.freetheai.org/symbols/NSE-HINDALCO">HINDALCO stock price</a> by FreeTheAI Stocks</p>