
Trifast plc
TRI · LSE · GBX
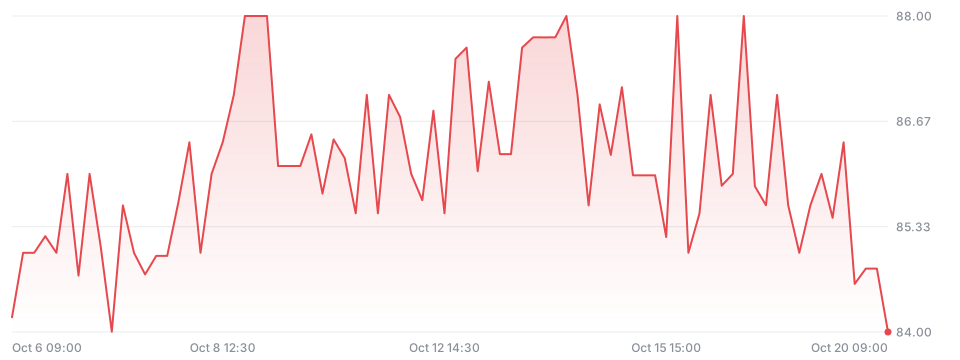
GBX 84.80
−1.20 −1.40%todayNot financial advice.
- Open
- 88.56
- Day range
- 84.00 - 88.56
- 52-week range
- 50.40 - 95.00
- Volume
- 119.36K
- Market cap
- 154.36M
- P/E ratio
- —
- EPS
- -0.01
- Dividend yield
- 2.21%
- Beta
- 0.93
Performance
W
−2.80%
1M
+6.00%
3M
+4.59%
6M
+22.54%
YTD
+21.38%
Y
+3.41%
5Y
−33.74%
All
+12.62%
In the news
Oct 20
Trifast Trading in Line With Expectations as Profit Margins Expand
Trifast plc reported H1 trading in line with market forecasts, driven by margin gains, UK growth, and international investments in Mexico and India.
Earnings
Embed on your site
Embed docsAdd a live price card or a chart to any page. Free, no sign-up; cards refresh every minute and link back here.
<iframe src="https://stocks.freetheai.org/embed/LSE-TRI" width="340" height="170" style="border:0;max-width:100%" loading="lazy" title="Trifast plc (TRI) - FreeTheAI Stocks"></iframe>
<p style="font-size:12px"><a href="https://stocks.freetheai.org/symbols/LSE-TRI">TRI stock price</a> by FreeTheAI Stocks</p>