
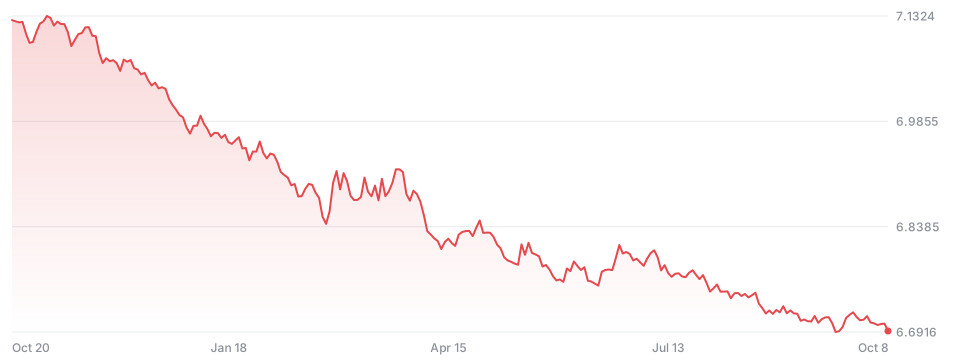
US Dollar vs. Offshore Chinese Yuan
USDCNH · FX · CNH
CNH 6.69
−0.0101 −0.15%todayNot financial advice.
- Open
- 6.70
- Day range
- 6.69 - 6.70
- 52-week range
- 6.69 - 7.15
- Volume
- 76.12K
- Market cap
- —
- P/E ratio
- —
- EPS
- —
- Dividend yield
- —
- Beta
- —
Performance
W
−0.31%
1M
−0.20%
3M
−1.51%
6M
−2.07%
YTD
−4.07%
Y
−6.20%
5Y
+3.73%
All
+336.28%
In the news
Oct 9
Offshore Yuan Strengthens to 6.69 Per Dollar as China Defends Exchange-Rate Policy
The offshore yuan rose to around 6.69 per dollar as China defended its currency policy during trade negotiations with the European Union.
Forex
Embed on your site
Embed docsAdd a live price card or a chart to any page. Free, no sign-up; cards refresh every minute and link back here.
<iframe src="https://stocks.freetheai.org/embed/FX-USDCNH" width="340" height="170" style="border:0;max-width:100%" loading="lazy" title="US Dollar vs. Offshore Chinese Yuan (USDCNH) - FreeTheAI Stocks"></iframe>
<p style="font-size:12px"><a href="https://stocks.freetheai.org/symbols/FX-USDCNH">USDCNH stock price</a> by FreeTheAI Stocks</p>