
Canada Employment Change
CAEMC · ECONOMICS
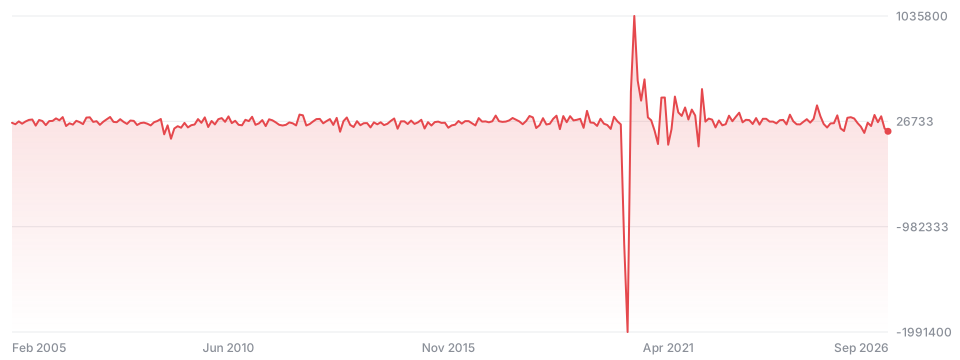
-68,300.00
−26,600.00 −63.79%todayNot financial advice.
- Open
- -68,300.00
- Day range
- -68,300.00 - -68,300.00
- 52-week range
- —
- Volume
- —
- Market cap
- —
- P/E ratio
- —
- EPS
- —
- Dividend yield
- —
- Beta
- —
In the news
Oct 9
Canadian Employment Falls by 68,300 in September, Marking Steepest Drop in Seven Months
Canada lost 68,300 jobs in September 2026, missing growth forecasts. The decline highlights widening weakness across the public sector and key provinces.
Economy
Embed on your site
Embed docsAdd a live price card or a chart to any page. Free, no sign-up; cards refresh every minute and link back here.
<iframe src="https://stocks.freetheai.org/embed/ECONOMICS-CAEMC" width="340" height="170" style="border:0;max-width:100%" loading="lazy" title="Canada Employment Change (CAEMC) - FreeTheAI Stocks"></iframe>
<p style="font-size:12px"><a href="https://stocks.freetheai.org/symbols/ECONOMICS-CAEMC">CAEMC stock price</a> by FreeTheAI Stocks</p>